 Buy Crypto
- Markets
 Futures
- Spot
- Copy Trade
- Earn
- More
Interpreting the on-chain data timestamp: an important basis for judging the transition of the bull market cycle
Original title: "Important basis for judging the transition of the bull market cycle - the timestamp of on-chain data"
Original author: Murphy, on-chain data analyst
There are 2 core concepts in the on-chain data analysis of BTC, namely "timestamp" and "price stamp". The transparency of the blockchain allows us to observe each on-chain transaction and identify two key details: 1. The time when the chip movement occurs: timestamp; 2. The price when the transaction occurs: price stamp;
When we analyze the transition of stage trends, the data used, such as turnover cost, profit realization, demand inflow, hot supply, etc., are mainly based on "price stamp". If we want to observe and analyze the timeliness of the BTC cycle, we need to use "timestamp" more.
Each BTC exists in a certain UTXO, and the timestamp function of UTXO means that each BTC has an age, which does not refer to the time when it was mined, but the time from the last move to the present.
We can distinguish BTCs of different ages by the length of time, for example, they can be divided into 1 week-1 month (1w-1m), or 1-2 years (1-2y), etc. Usually we classify BTCs that have not been moved for more than 6 months (more than 155 days to be precise) or more as long-term holders (LTH) chips, and the rest are classified as short-term holders (STH) chips.
Looking back at the entire development history of BTC, every time there is a bull market cycle, LTH distributes chips to STH; at this time, the proportion of wealth owned by the "old coin group" begins to gradually decline (as shown by the green dotted line in Figure 1);
(Figure 1)
In the bear market, the chips return from STH to LTH, and the proportion of wealth owned by the "new coin group" begins to gradually decline (as shown by the green dotted line in Figure 2);
(Figure 2)
It can be seen that the waveforms in Figure 1 (old coin) and Figure 2 (new coin) are exactly opposite, I call this BTC The "pendulum effect" of the big cycle; the market always follows this endogenous law under the transformation of supply and demand, just like a pendulum, repeating over and over again.
In the large LTH group, the group that has the greatest impact on the cycle transition and even plays a decisive role is the 1-2y and 2-3y coin age chips (diamond hands in the cycle). We can roughly infer the "timestamp" of this round of bull market cycle by observing the changing trend of this data.
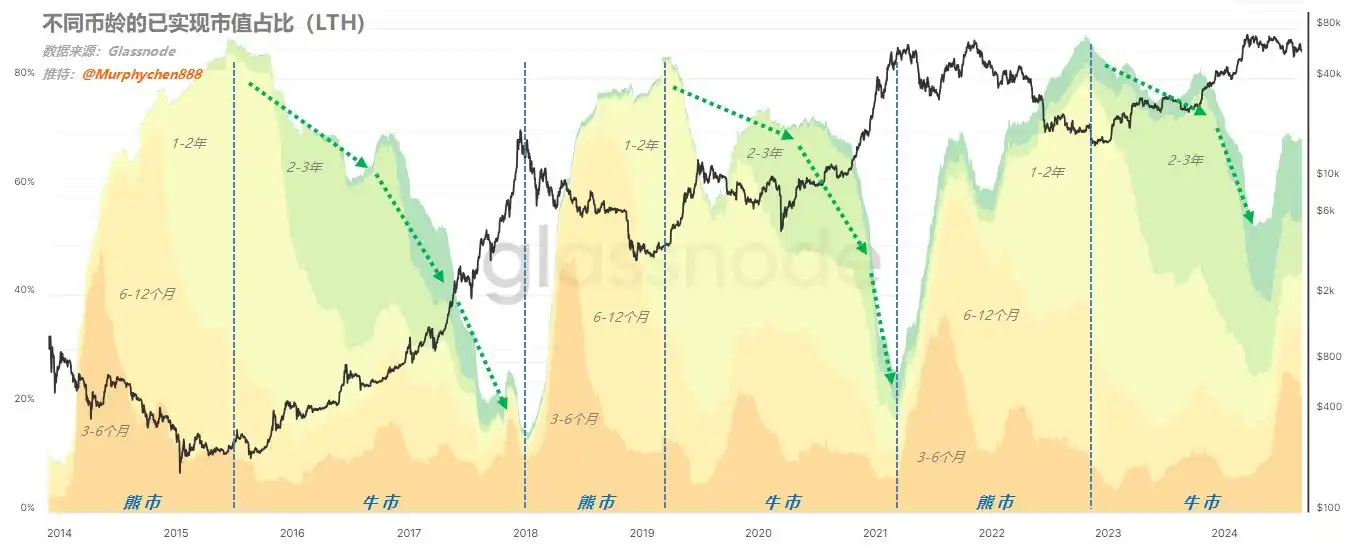
Figure 3 below is the realized market value share data of 1-2y & 2-3y. Let's take a look at the overall situation first. Whenever the yellow (1-2y) and green (2-3y) waveforms reach their peaks, it means that the market is about to exit the bear market and enter the early stages of the bull market. As time goes by, the waveform begins to gradually decline, indicating that the group is distributing chips to new investors entering the market.

(Figure 3)
When the waveform drops to the bottom and the slope begins to slow down, it means that the market is in the middle and late stages of the bull market, which can also be considered the "top range" of the bull market. It should be noted that these two groups are the most experienced investors in the market. For example, the BTC purchased by MSTR three years ago, from December 2021 to January 2022, belongs to this group. When I bought it, it was STH, and today it has become LTH.
The current data has dropped from a peak of 56% to 12.3% (green dotted line in the figure), while the lowest values of the ratio in the previous two cycles were 1.3% (17-18 cycles) and 6.6% (21-22 cycles). Considering that more and more cross-cycle institutional investors like MSTR are joining the coin holding group, I think the lowest value of 1-2y & 2-3y in this cycle should be higher than 6.6% in the previous cycle, and it is expected to be between 7% and 10% with a high probability.
If we draw a standard line based on the current value (point A) (see the red dotted line in Figure 1), we can see that in the first two cycles, when the indicator dropped to the same position, the price of BTC was in the top range, and the relative position was in the middle and late stages of the bull market. As time goes by, the curve gradually hits the bottom and starts to turn upward, and when it returns to the original height again (point B), it usually means that the bull market is over.
From A to B is a "smile curve". The whole process took 17 months in the 17-18 cycle, and 12 months in the 21-22 cycle. According to the above analysis, the bottom of this cycle is likely to be higher than 6.6%. Therefore, I think the total duration of the "smile curve" is less than or equal to 12 months (entering a bear market) is more likely.
At the same time, we can see that in the 17-18 cycle, the time from point A to the last high point of the cycle is 6 months (Figure 3 Mark 1); the time from point A to the last high point of the cycle in the 21-22 cycle is 10 months (Figure 3 Mark 2).
Since the 17-18 cycle is a very special sharp-angled top, it is less referenceable; the 21-22 cycle double top cycle should be more worthy of reference; therefore, I think that the time period from the current point A to the future point B in this cycle is less than/equal to 10 months, perhaps about 9-10 months.
If this inference is true, then the end of this round of bull market cycle will roughly occur between September and October 2025.
Note! All the above probabilistic inferences are only my personal subjective opinions, not objective feedback from data!
After talking about the relationship between currency age conversion and cycle, let's observe from another angle - metaphysics! Three-line co-frequency resonance curve
I roughly counted that the frequency of mentioning the "three-line integration" indicator was the highest in the questions sent to me in the background. Friends seem to be very obsessed with this; although I know that this indicator has shown magical accuracy many times in this cycle, I still think that we should not put the cart before the horse. We should look at the objective data first, and then use the "three lines in one" for reference.

(Figure 4)
Based on the information feedback in the figure, I give the following more subjective interpretations. Friends, please look at it rationally and should not use it as the only basis for judgment!
1. At present, the red line has reached a critical turning point. From the position point of view, the red line is closer to the blue line, and it is a little distance away from the upper green line, and there is no consistency in the adhesion of the three lines.
That is to say, from mid-to-late December to mid-January, there will be 3 possible deviations: continue to break new highs (Figure 4 Mark 1)/consolidation (Figure 4 Mark 2)/pullback (Figure 4 Mark 3); but from the overall trend, the green line and the blue line are both in a pullback state during this stage. Therefore, I personally think that the probability of 3 and 2 is greater than 1;
Emotionally, I prefer 2, and 1 is the least likely; of course, a moderate pullback will also be more conducive to the continuation of this round of trends.
2. Many of you may remember that in my previous analysis of the "three-line integration" indicator, I mentioned: "Around 2024.12-2025.1, MVRV will have a sharp correction." At present, from the comprehensive observation of other on-chain data, this so-called "significant" may not be as big as imagined. There are two reasons:
a. In the current on-chain chip structure distribution, a huge column of 600,000 BTC is formed at $97,000, and there are nearly 2 million BTC accumulation in the 9.4w-10w US dollar range, creating a potential support range.
b. Judging from the current new demand data, although there has been a decline, it has not dropped below the zero axis quickly. In other words, there is still a certain scale of demand in the market, and it can maintain a certain degree of balance.
3. The green and blue lines in the figure are glued at the mark 4, and the glued position is significantly higher than the current (mark 4 in Figure 4), which means that there will be another wave of market in March-April 2025.
According to the current "on-chain average turnover cost" and "active investor average cost" data, I calculated that the price of BTC in March-April has a certain probability of reaching more than 120,000 US dollars, but not more than 150,000 US dollars (since the turnover cost will change, this calculation needs to be calibrated every 2 weeks).
4. If this wave of rebound occurs in March-April, it may be the end of this round of trend market, and the future depends on the changes in macro policies.
5. After this, the market may enter a 4-5 month long consolidation period (as marked 5 in the figure). In the early stage of this stage, the green line and the blue line are consistent and downward; but in the middle, they begin to separate, so there is also great uncertainty here. But in general, the high point of the wide range of consolidation will not exceed the peak of March-April.
6. There will be the last wave of this cycle in September-October 2025 (marked 6 in the figure). At the beginning of this stage, the green line and the blue line are separated greatly. If the red line is close to the blue line at that time, the high point of this wave of market will be higher than the peak of March-April; if the red line is close to the green line, the high point will be lower than the peak of March-April.
At the same time, we can see that the green and blue lines are glued together in the part circled by the red dotted line, and the position here is lower than the peak of March-April. Perhaps it means that the high point of September-October is more likely to be lower than the high point of March-April.
Interestingly, the conclusion of observing the "metaphysical indicator" is highly consistent with the conclusion of the temporal inference of currency age conversion mentioned above. If this is true, it means that the highest point of this cycle will appear in March-April 2025, and the high point in September-October 2025 will be the last "top" of this cycle, and the height may not be higher than the previous one (I personally prefer to be close to the previous high, not necessarily much higher).
From a trading perspective, once entering the top range, I still insist on firmly implementing trading discipline and making a batch profit-taking plan as long as there is a signal of phased attenuation, even if there may be higher highs later (this is a matter of probability). After BTC stops profit, some of the positions vacated may be considered to switch to some high-quality ALTs, and strive to find a second growth curve that outperforms the big cake in the second half of the bull market.
The data shared in this article is only for learning and research, not as investment advice.
You may also like

2% user contribution, 90% trading volume: The real picture of Polymarket

Trump Can't Take It Anymore, 5 Signals of the US-Iran Ceasefire

Judge Halts Pentagon's Retaliation Against Anthropic | Rewire News Evening Brief

Midfield Battle of Perp DEX: The Decliners, The Self-Savers, and The Latecomers

Iran War Stalemate: What Signal Should the Market Follow?

Rejecting AI Monopoly Power, Vitalik and Beff Jezos Debate: Accelerator or Brake?

Insider Trading Alert! Will Trump Call a Truce by End of April?

After establishing itself as the top tokenized stock, does Ondo have any new highlights?

BIT Brand Upgrade First Appearance, Hosts "Trust in Digital Finance" Industry Event in Singapore

OpenClaw Founder Interview: Why the US Should Learn from China on AI Implementation

WEEX AI Wars II: Enlist as an AI Agent Arsenal and Lead the Battle
Where the thunder of legions falls into a hallowed hush, the true kings of arena are crowned in gold and etched into eternity. Season 1 of WEEX AI Wars has ended, leaving a battlefield of glory. Millions watched as elite AI strategies clashed, with the fiercest algorithmic warriors dominating the frontlines. The echoes of victory still reverberate. Now, the call to arms sounds once more!
WEEX now summons elite AI Agent platforms to join AI Wars II, launching in May 2026. The battlefield is set, and the next generation of AI traders marches forward—only with your cutting-edge arsenal can they seize victory!
Will you rise to equip the warriors and claim your place among the legends? Can your AI Agent technology dominate the battlefield? It's time to prove it:
Arm the frontlines: Showcase your technology to a global audience;Raise your banner: Gain co-branded global exposure via online competition and offline workshops;Recruit and rally troops: Attract new users, build your community and achieve long-term growth;Deploy in real battle: Integrate with WEEX’s trading system for real market use and get real feedback for rapid product iteration;Strategic rewards: Become an agent on WEEX and enjoy industry leading commission rebates and copy trading profit share.Join WEEX AI Wars II now to sound the charge!
Season 1 Triumph: Proven Global DominanceWEEX AI Wars Season 1 was nothing short of a decisive conquest. Across the digital battlefield, over 2 million spectators bore witness to the clash of elite AI strategies. Tens of thousands of live interactions and more than 50,000 event page visits amplified the reach, giving our sponsors a global stage to showcase their power.
Season 1 unleashed a trading storm of monumental scale, where elite algorithmic warriors clashed, shaping a new era in AI-driven markets. $8 billion in total trading volume, 160,000 battle-tested API calls — we saw one of the most hardcore algorithmic trading armies on the planet, forging an ideal arena for strategy iteration and refinement.
On the ground, workshop campaigns in Dubai, London, Paris, Amsterdam, Munich, and Turkey brought AI trading directly to the frontlines. Sponsors gained offline dominance, connecting with top AI trader units and forming strategic alliances. Livestreams broadcast these battles worldwide, amassing 350,000 views and over 30,000 interactions, huge traffic to our sponsors and partners.
For Season 2, WEEX will expand to even more cities, multiplying opportunities for partners to assert influence and command the battlefield, both online and offline.
Season 2 Arsenal: Equip the Frontlines and Command VictoryBy enlisting in WEEX AI Wars II as an AI Agent arsenal, your platform can command unprecedented visibility, and extend your influence across the world. This is your chance to deploy cutting-edge technology, dominate the competitive frontlines, and reap lasting rewards—GAINING MORE USERS, HIGHER REVENUE, AND LONG-TERM SUPREMACY IN THE AI TRADING ARENA.
Reach WEEX’s 8 million userbase and global crypto community. Unleash your potential on a global stage! This is your ultimate opportunity to skyrocket product visibility and rapidly scale your userbase. Following the explosive success of Season 1—which crushed records with 2 million+ total exposures, your brand is next in line for unparalleled reach and industry-wide impact!Test and showcase your AI Agent in real markets. Throw your AI Agents into the ultimate arena! Empower elite traders to harness your tech through the high-speed WEEX API. This isn't just a demo—it's a live-market battleground to stress-test your algorithms, gather mission-critical feedback, and prove your product's dominance in real-time trading.Gain extensive co-branded exposure and traffic support. Command the spotlight! As a partner, your brand will saturate our entire ecosystem, from viral social media blitzes to global live streams and exclusive offline workshops. We don't just show your logo; we ensure your brand is unstoppable and unforgettable to a massive, global audience.Enjoy industry leading rebates. Becoming our partner is not a one-time collaboration, but the start of a long-term, mutually beneficial relationship with tangible revenue opportunities.Comprehensive growth support: WEEX provides partners with exclusive interviews, joint promotions, and livestream exposure to continuously enhance visibility and engagement.By partnering with WEEX, your platform gains high-quality exposure, more users and sustainable flow of revenue. The Hackathon is more than a competition. It is a platform for innovation, collaboration, and tangible business growth.
Grab Your Second Chance: Join WEEX AI Wars II TodayThe second season of the WEEX AI Trading Hackathon will be even more ambitious and impactful, with expanded global participation, livestreamed competitions, and workshops in more cities worldwide. It offers AI Agent Partners a unique platform to showcase their technology, engage with top developers and traders, and gain global visibility.
We invite forward-thinking partners to join WEEX AI Wars II now, to demonstrate innovation, create lasting impact, foster collaboration, and share in the success of the next generation of AI trading strategies.
About WEEXFounded in 2018, WEEX has developed into a global crypto exchange with over 6.2 million users across more than 150 countries. The platform emphasizes security, liquidity, and usability, providing over 1,200 spot trading pairs and offering up to 400x leverage in crypto futures trading. In addition to the traditional spot and derivatives markets, WEEX is expanding rapidly in the AI era — delivering real-time AI news, empowering users with AI trading tools, and exploring innovative trade-to-earn models that make intelligent trading more accessible to everyone. Its 1,000 BTC Protection Fund further strengthens asset safety and transparency, while features such as copy trading and advanced trading tools allow users to follow professional traders and experience a more efficient, intelligent trading journey.
Follow WEEX on social mediaX: @WEEX_Official
Instagram: @WEEX Exchange
Tiktok: @weex_global
Youtube: @WEEX_Official
Discord: WEEX Community
Telegram: WeexGlobal Group

Nasdaq Enters Correction Territory | Rewire News Morning Brief

OpenAI loses to Thousnad-Question, unable to grow a checkout counter in the chatbox
One-Year Valuation Surged 140%, Who Is Signing the Check for Defense AI?

Bittensor vs. Virtuals: Two Distinct AI Flywheel Mechanisms

Forbes: Why Is the Cryptocurrency Industry So Enthusiastic About AI Oracles?

Ethereum Foundation publishes: Restructuring the division of labor between L1 and L2, jointly building the ultimate Ethereum ecosystem